Don’t predict the market. Map it.
QuantMap turns 70 years of stock and index data into the price levels that matter, drawn on your chart before the open.
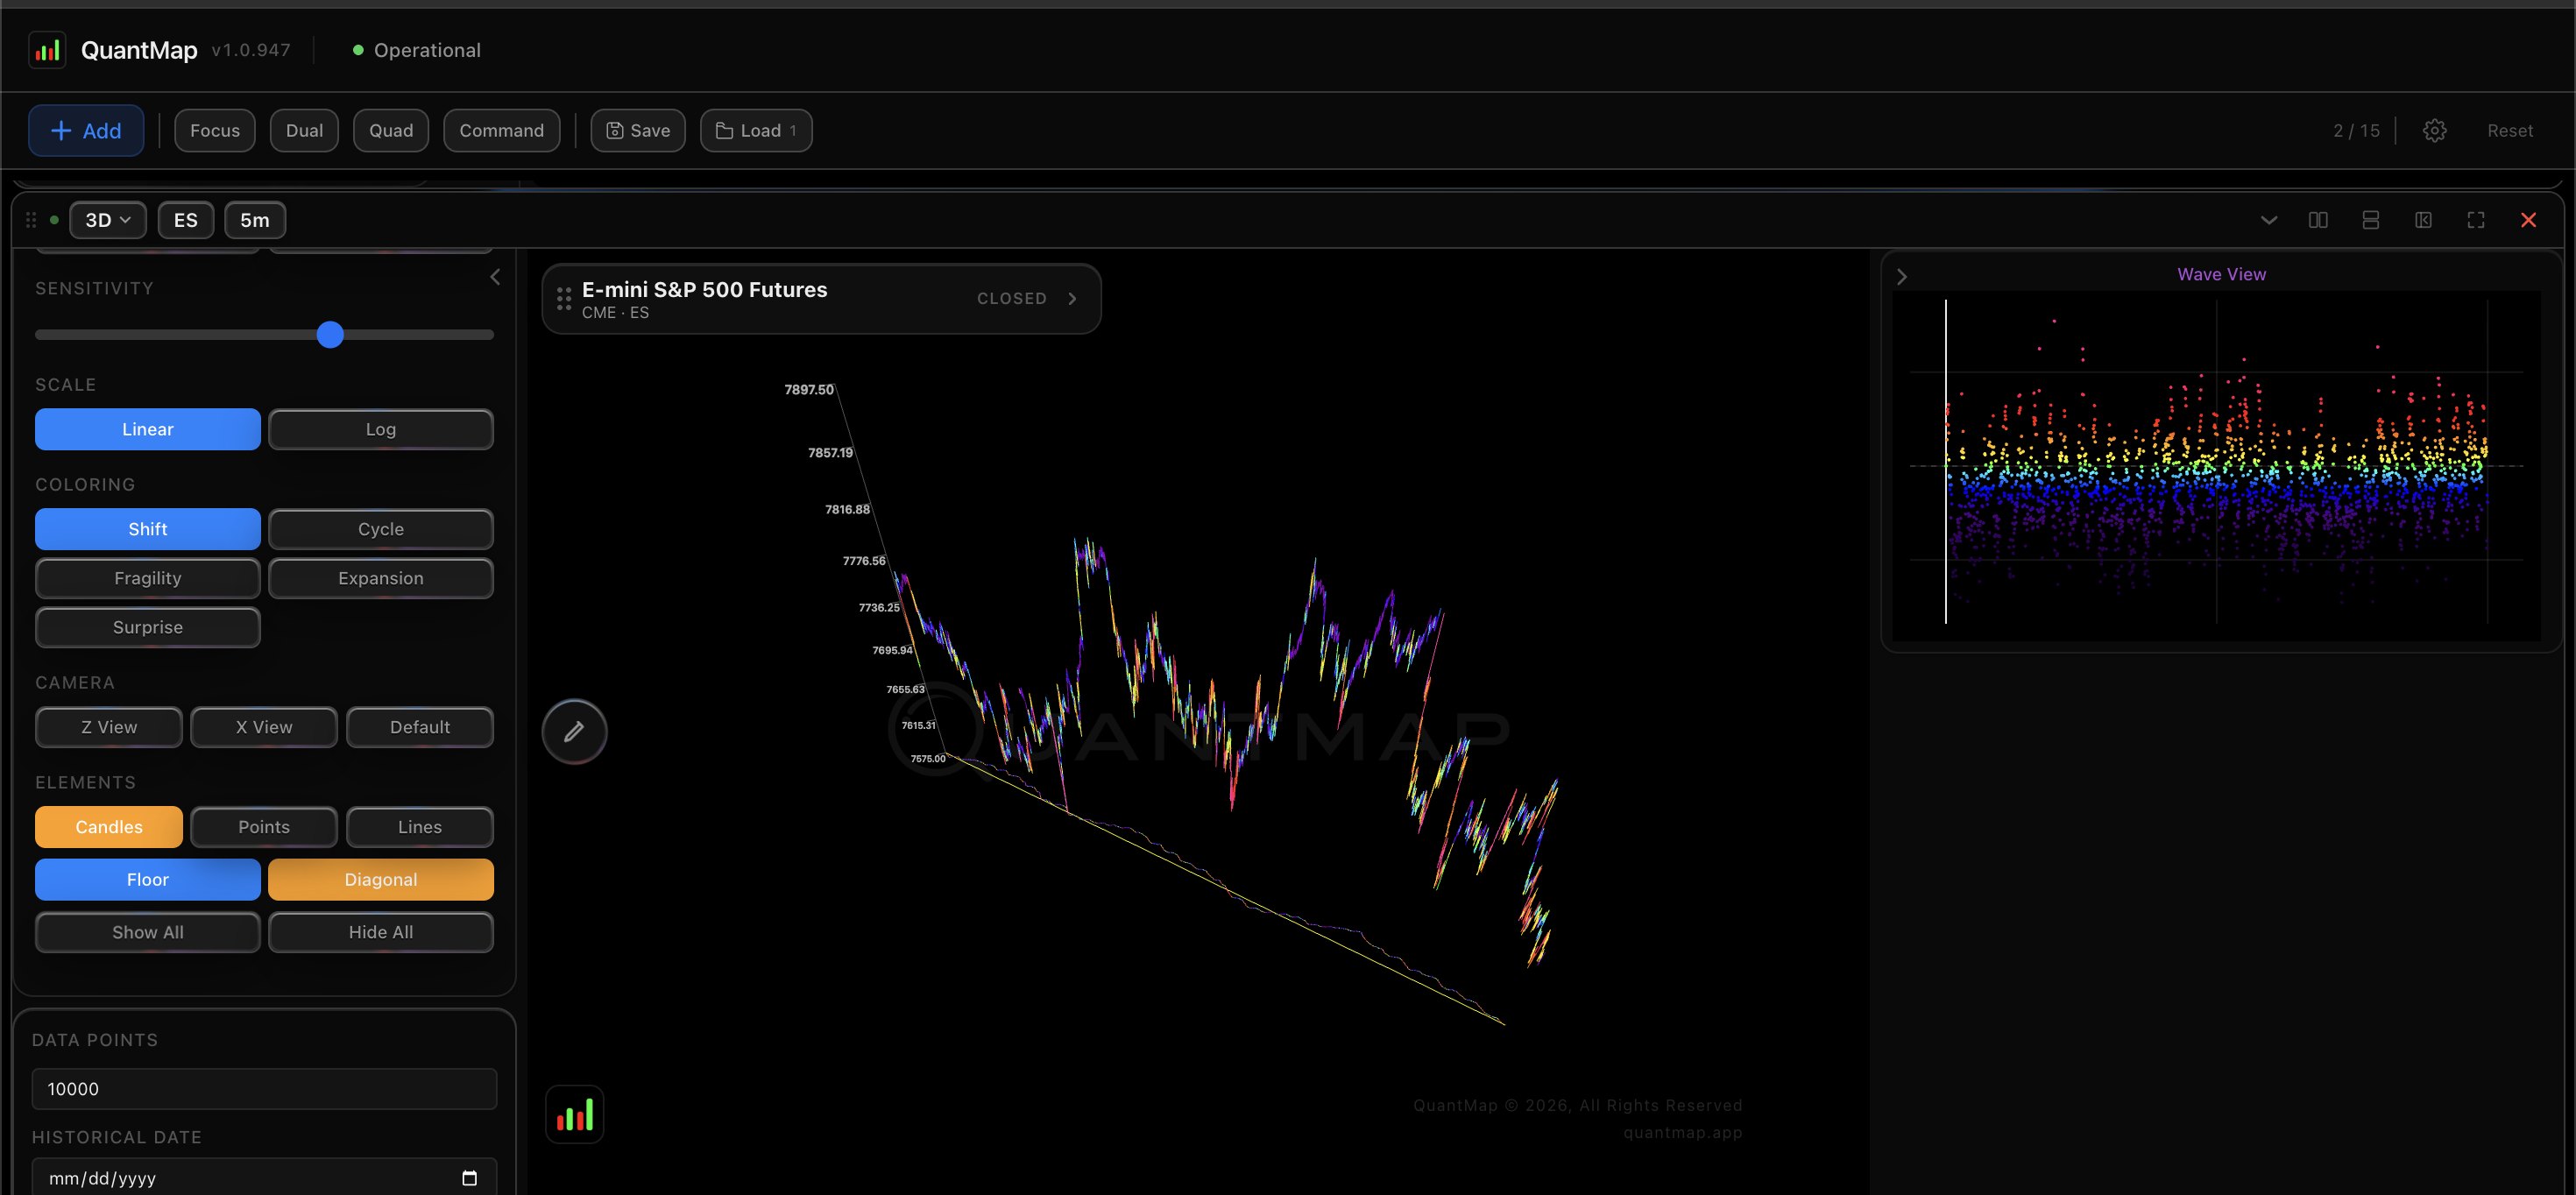
Thousands of possible next hours.
Every line is a path ES could take from here, simulated from the real session. Most of them run into the same few prices.
QuantMap maps where they meet.
Resistance, pivot and support, set before the first candle prints.
Then the market arrives.
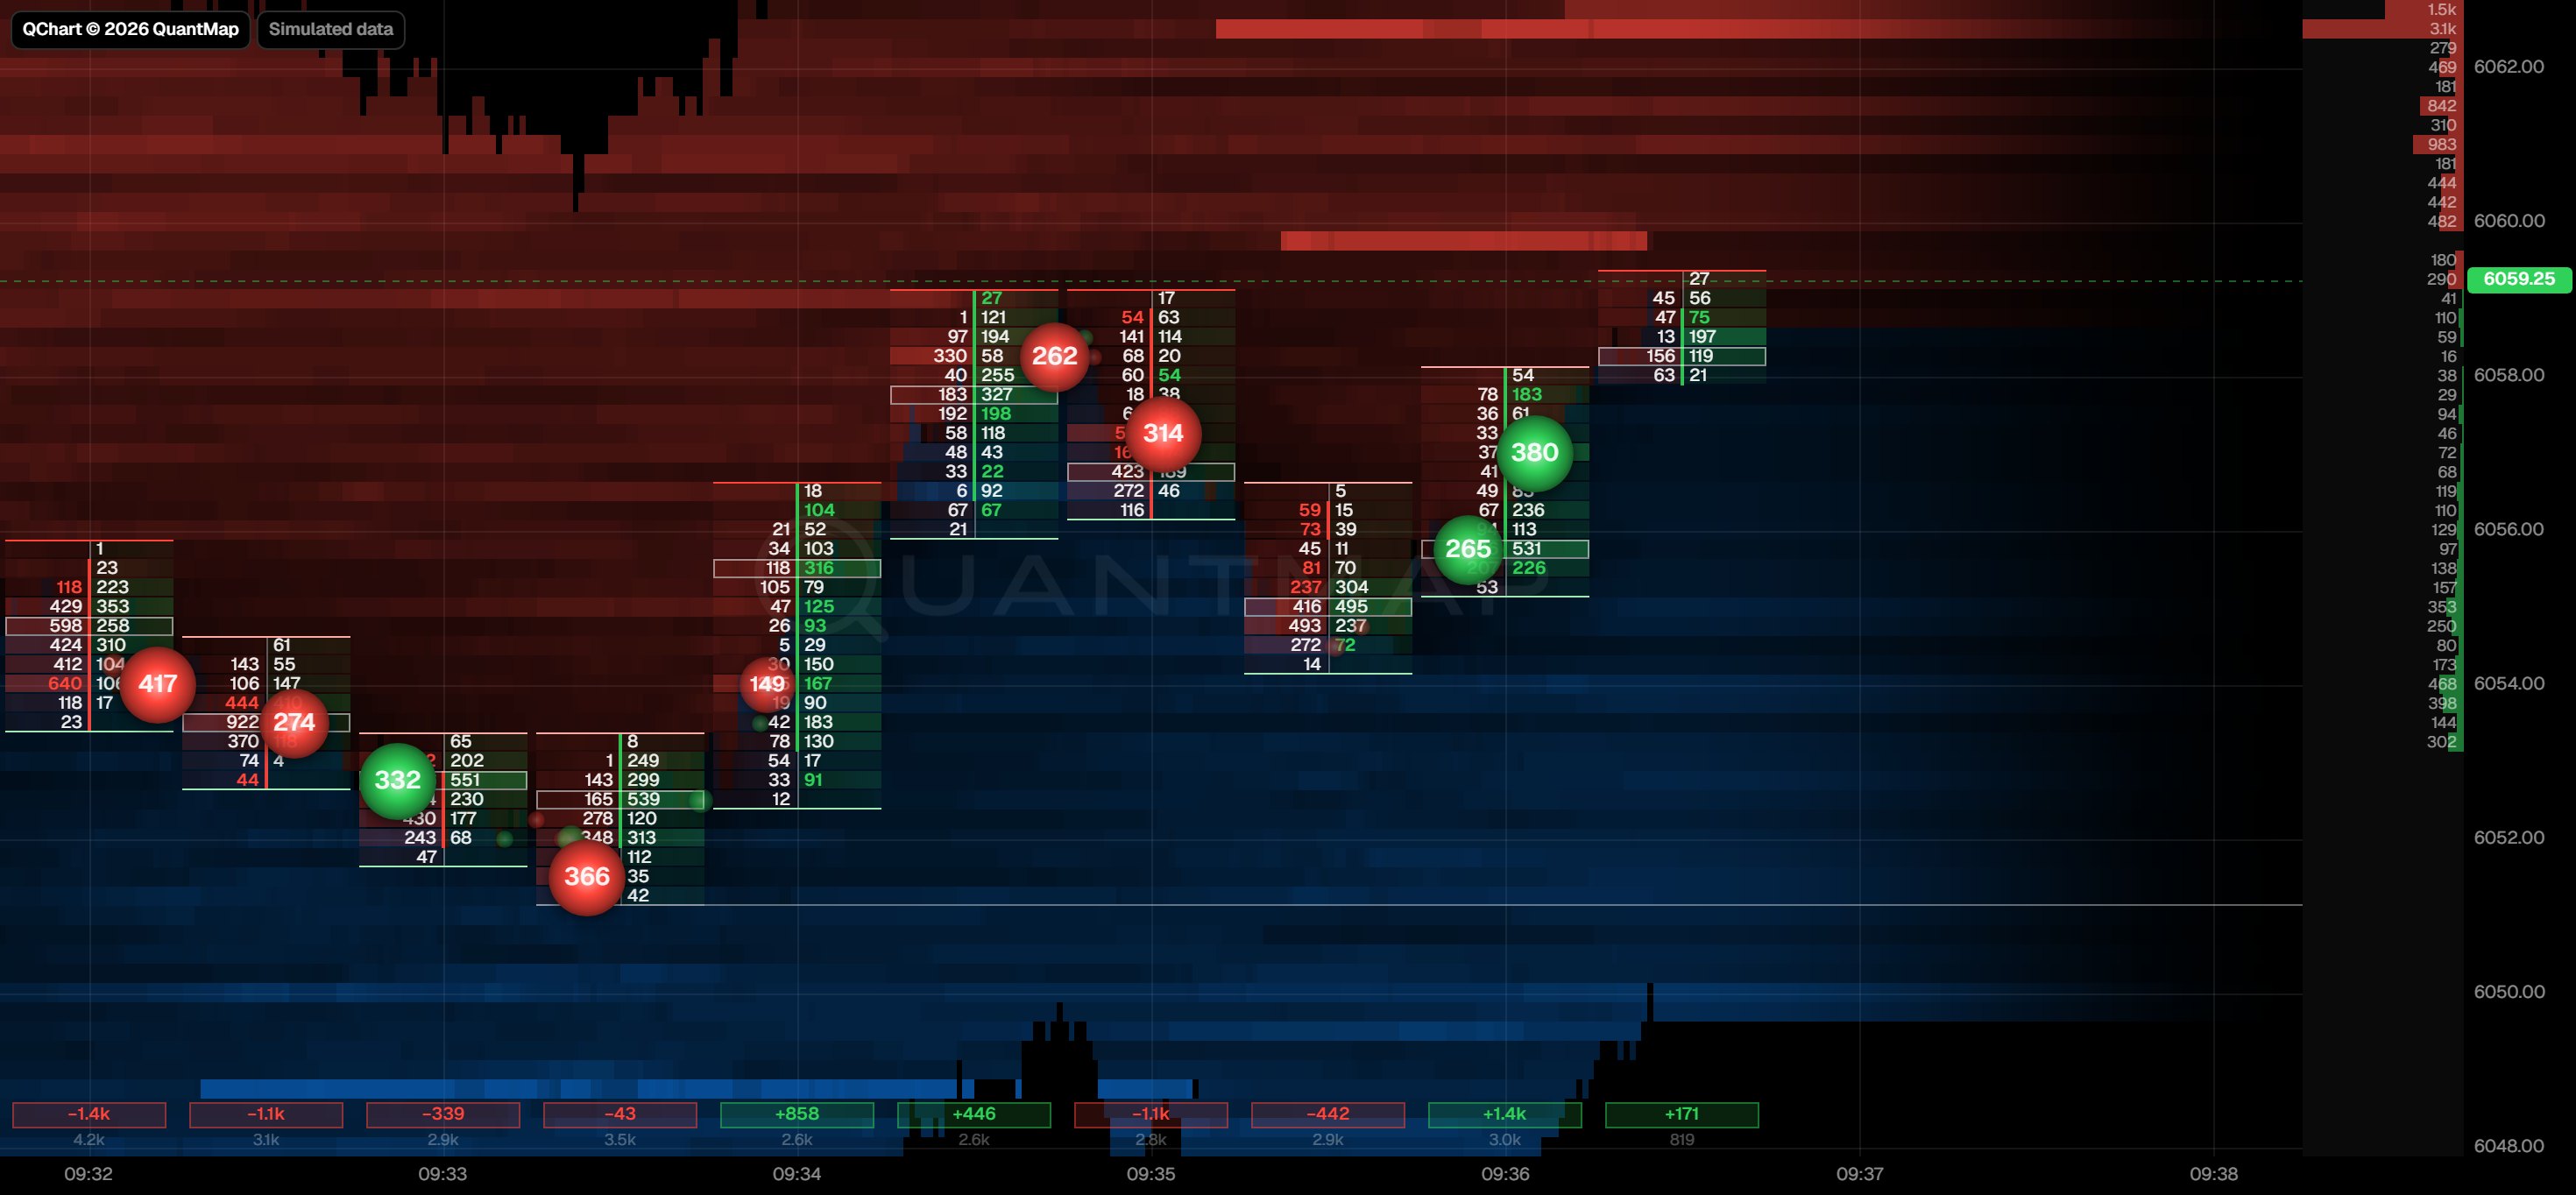
ES opened right at the pivot and traded between it and support for most of the night.
One real session, shown as an example. Not a performance claim.